Jones Hollow Realty Group dives into the 2025 real estate trends on Long Island. We examine Nassau and Suffolk counties closely. Inventory shrank while prices surged. Mortgage rates eased slightly. We also forecast 2026 based on expert views. This recap helps buyers and sellers plan ahead.
Inventory Levels Tighten in 2025
Buyers faced fewer options in 2025. Nassau County ended November with 2.5 months of supply. This dropped 10.3% from 2024. Suffolk County saw 2.7 months, down 10%. Overall, active listings fell to 5,114 homes by year’s end. Nassau had 2,159 listings. Suffolk counted 2,955. These low levels fueled competition. However, some areas showed slight increases mid-year. For more data, check the Federal Reserve Economic Data site.
Home Prices Climb Higher
Sellers enjoyed strong gains in 2025. Nassau County’s median price hit $840,000 in November. This rose 8.4% from $775,000 in 2024. Suffolk reached $725,000, up 11.1% from $652,500. Year-over-year, values increased 3.6% to $812,770 in Nassau. Suffolk saw similar momentum. Demand drove these hikes despite tight supply. Additionally, luxury segments grew faster. Visit Zillow for historical trends.

Mortgage Rates and 2026 Outlook
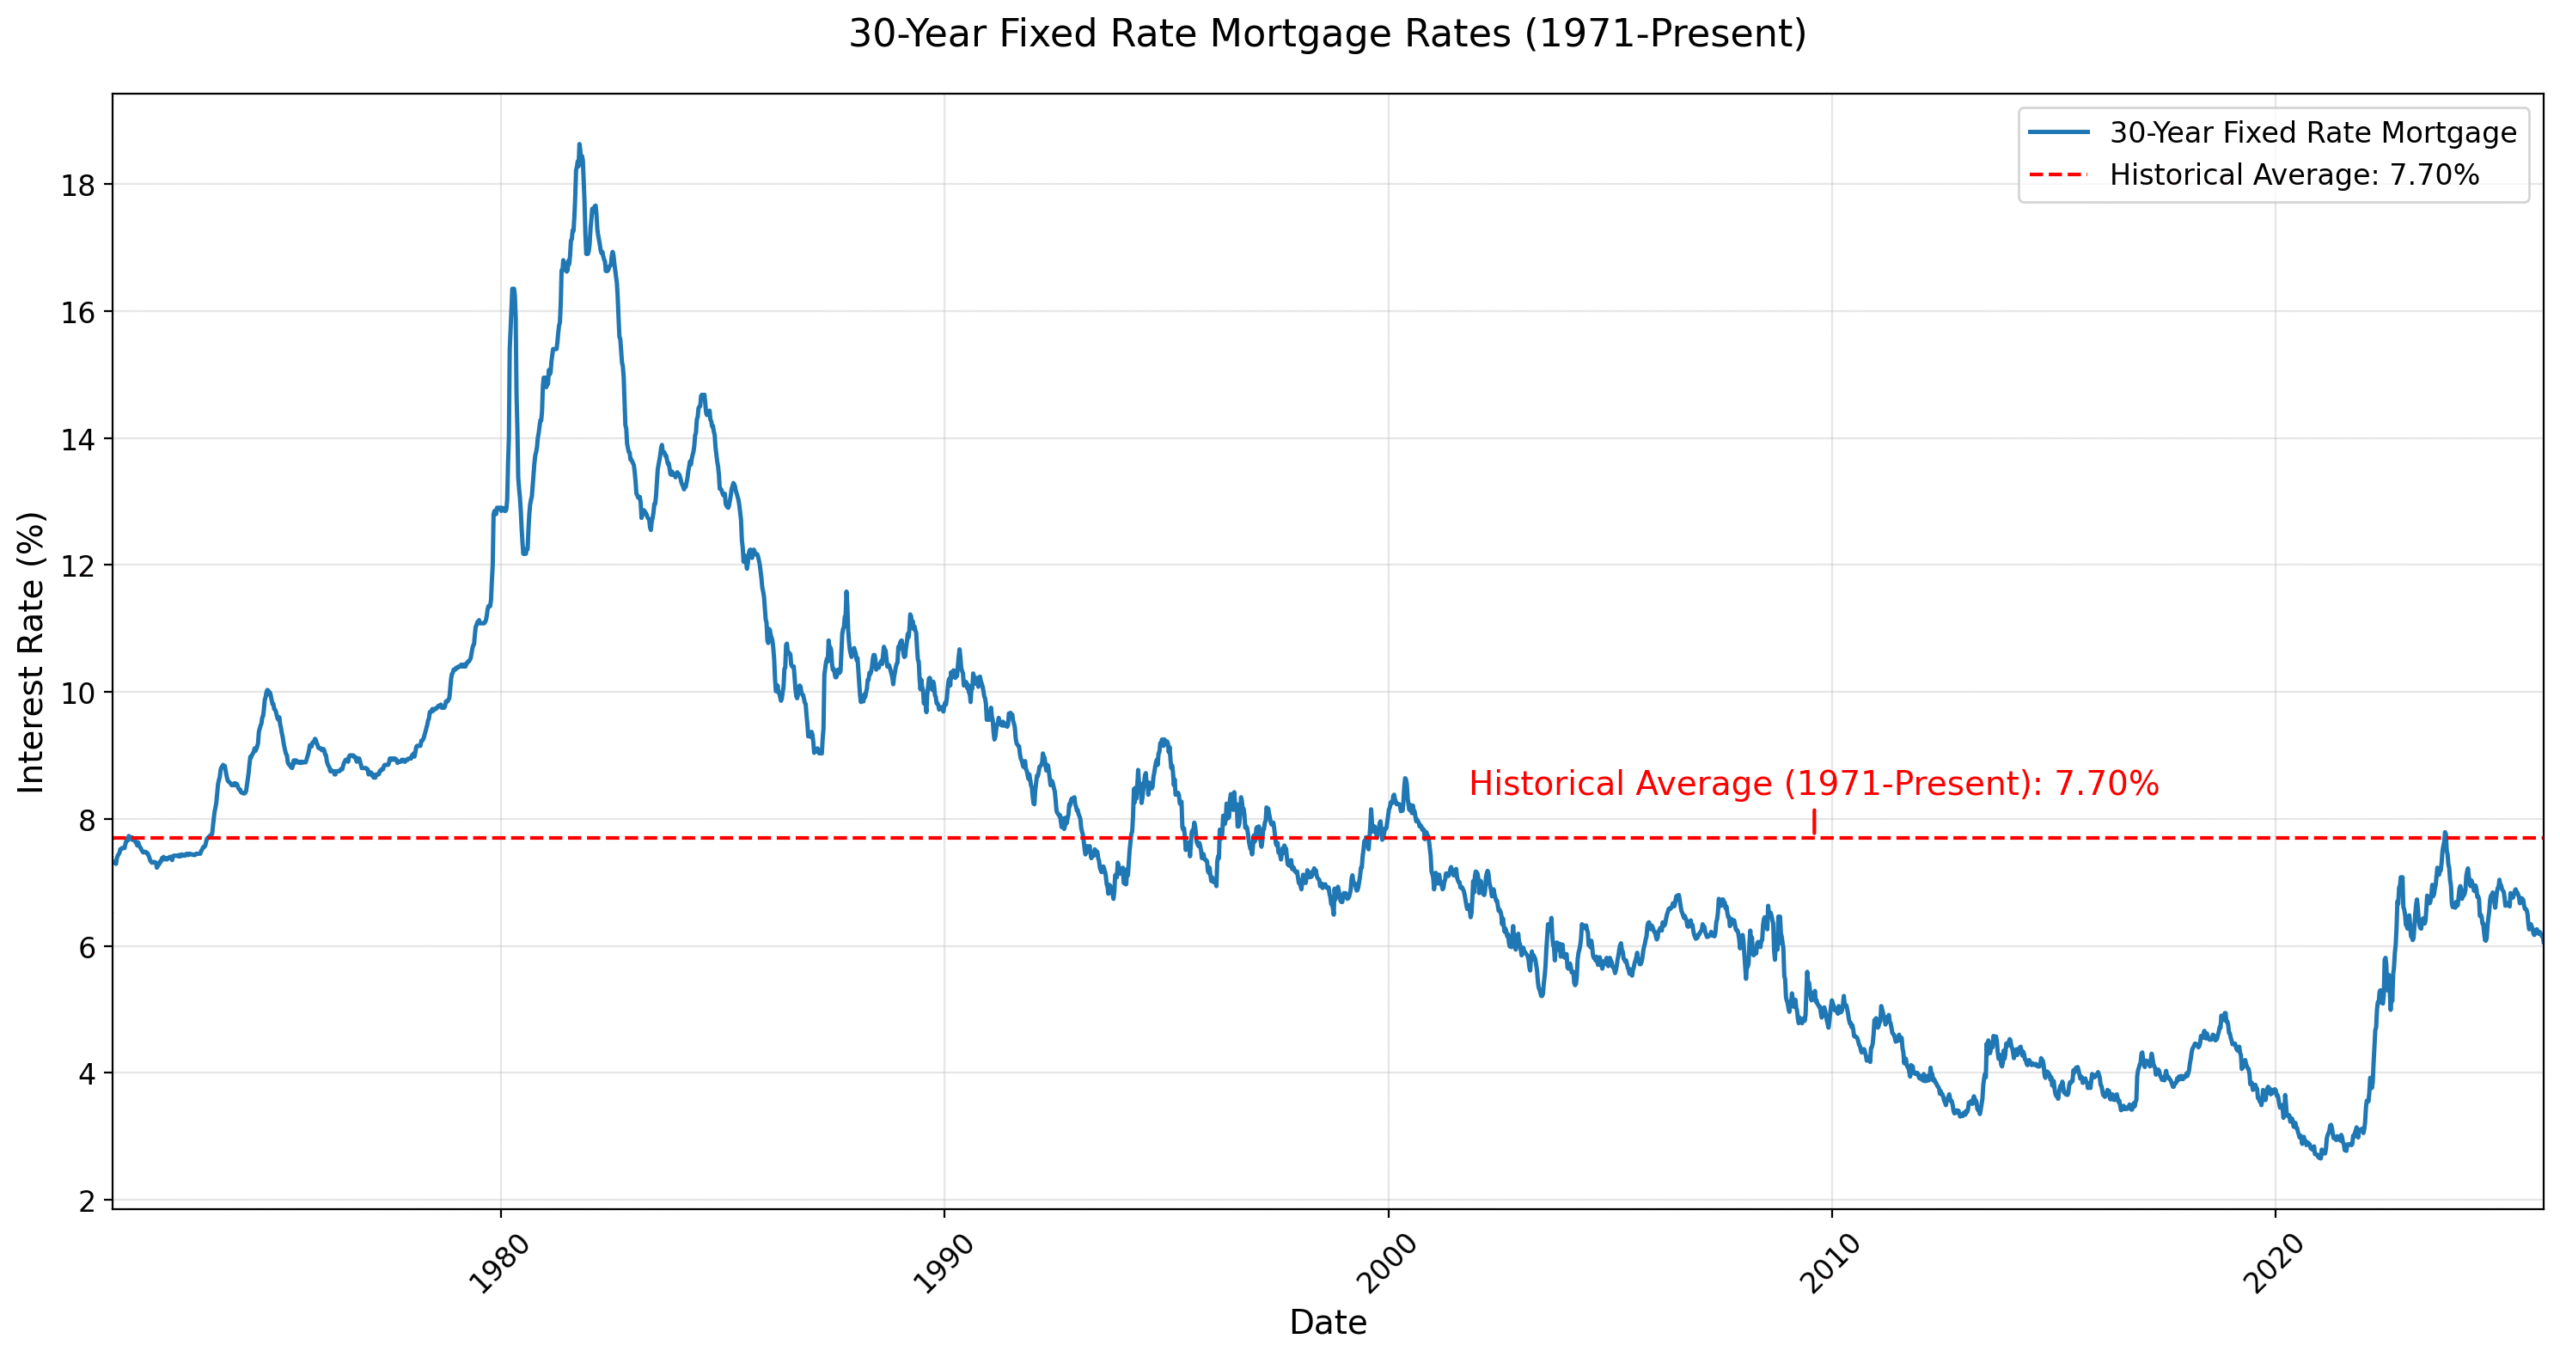
Rates challenged buyers in 2025. The average 30-year fixed rate stayed around 6.5%. It dipped to 6.06% by December. This eased from 2024 peaks. For 2026, experts predict further drops. Fannie Mae forecasts 5.9%. The Mortgage Bankers Association sees 6.4%. Lower rates could add 500,000 home sales. As a result, affordability improves. Check Freddie Mac for weekly updates.
Predictions for 2026 Market
Industry leaders spot positive shifts for 2026. Inventory may rise modestly. This balances the market. Sales could jump 10% with lower rates. Prices might grow 2%. The National Association of Realtors expects more first-time buyers. However, inflation risks remain. Overall, we anticipate a busier spring season. These changes favor prepared clients.
10-Year Trends in Inventory, Prices, and Rates
Inventory trended down over 10 years. Nassau listings fell from over 4,000 in 2016 to 1,972 in 2025. Prices doubled in many spots. The house price index rose from 300 in 2015 to 489 in 2025 for Nassau-Suffolk. Rates fluctuated wildly. They hit 3.66% in 2012, peaked at 7.79% in 2023, then eased. Explore FRED for full datasets.
Looking Ahead with Jones Hollow
2025 marked resilience on Long Island. Tight inventory pushed prices up. Rates began to cool. For 2026, we see opportunities grow. Contact us for personalized advice.